Net Zero by 2050
TCC joined the UN Climate Action and aimed to solve the complex relationship between humans and nature and search for a balance between the development of civilization and the environment

|
2025
|
TAIWAN SBT
-11% Scope 1 Intensity|-32% Scope 2 Intensity
-11% Scope 1+2 Intensity (Estimated under Science Based Target Setting Tool)
|
2030 |
TAIWAN
-31% Carbon Emission Intensity*
Net Zero in Offices of Operation Headquarters and Low-carbon R&D center
MAINLAND CHINA
-20% Carbon Emission Intensity*
|
2050 |
TCC GROUP
Carbon Neutral Concrete Products
|
* The reduction will be implemented according to regulatory permissions and market demands
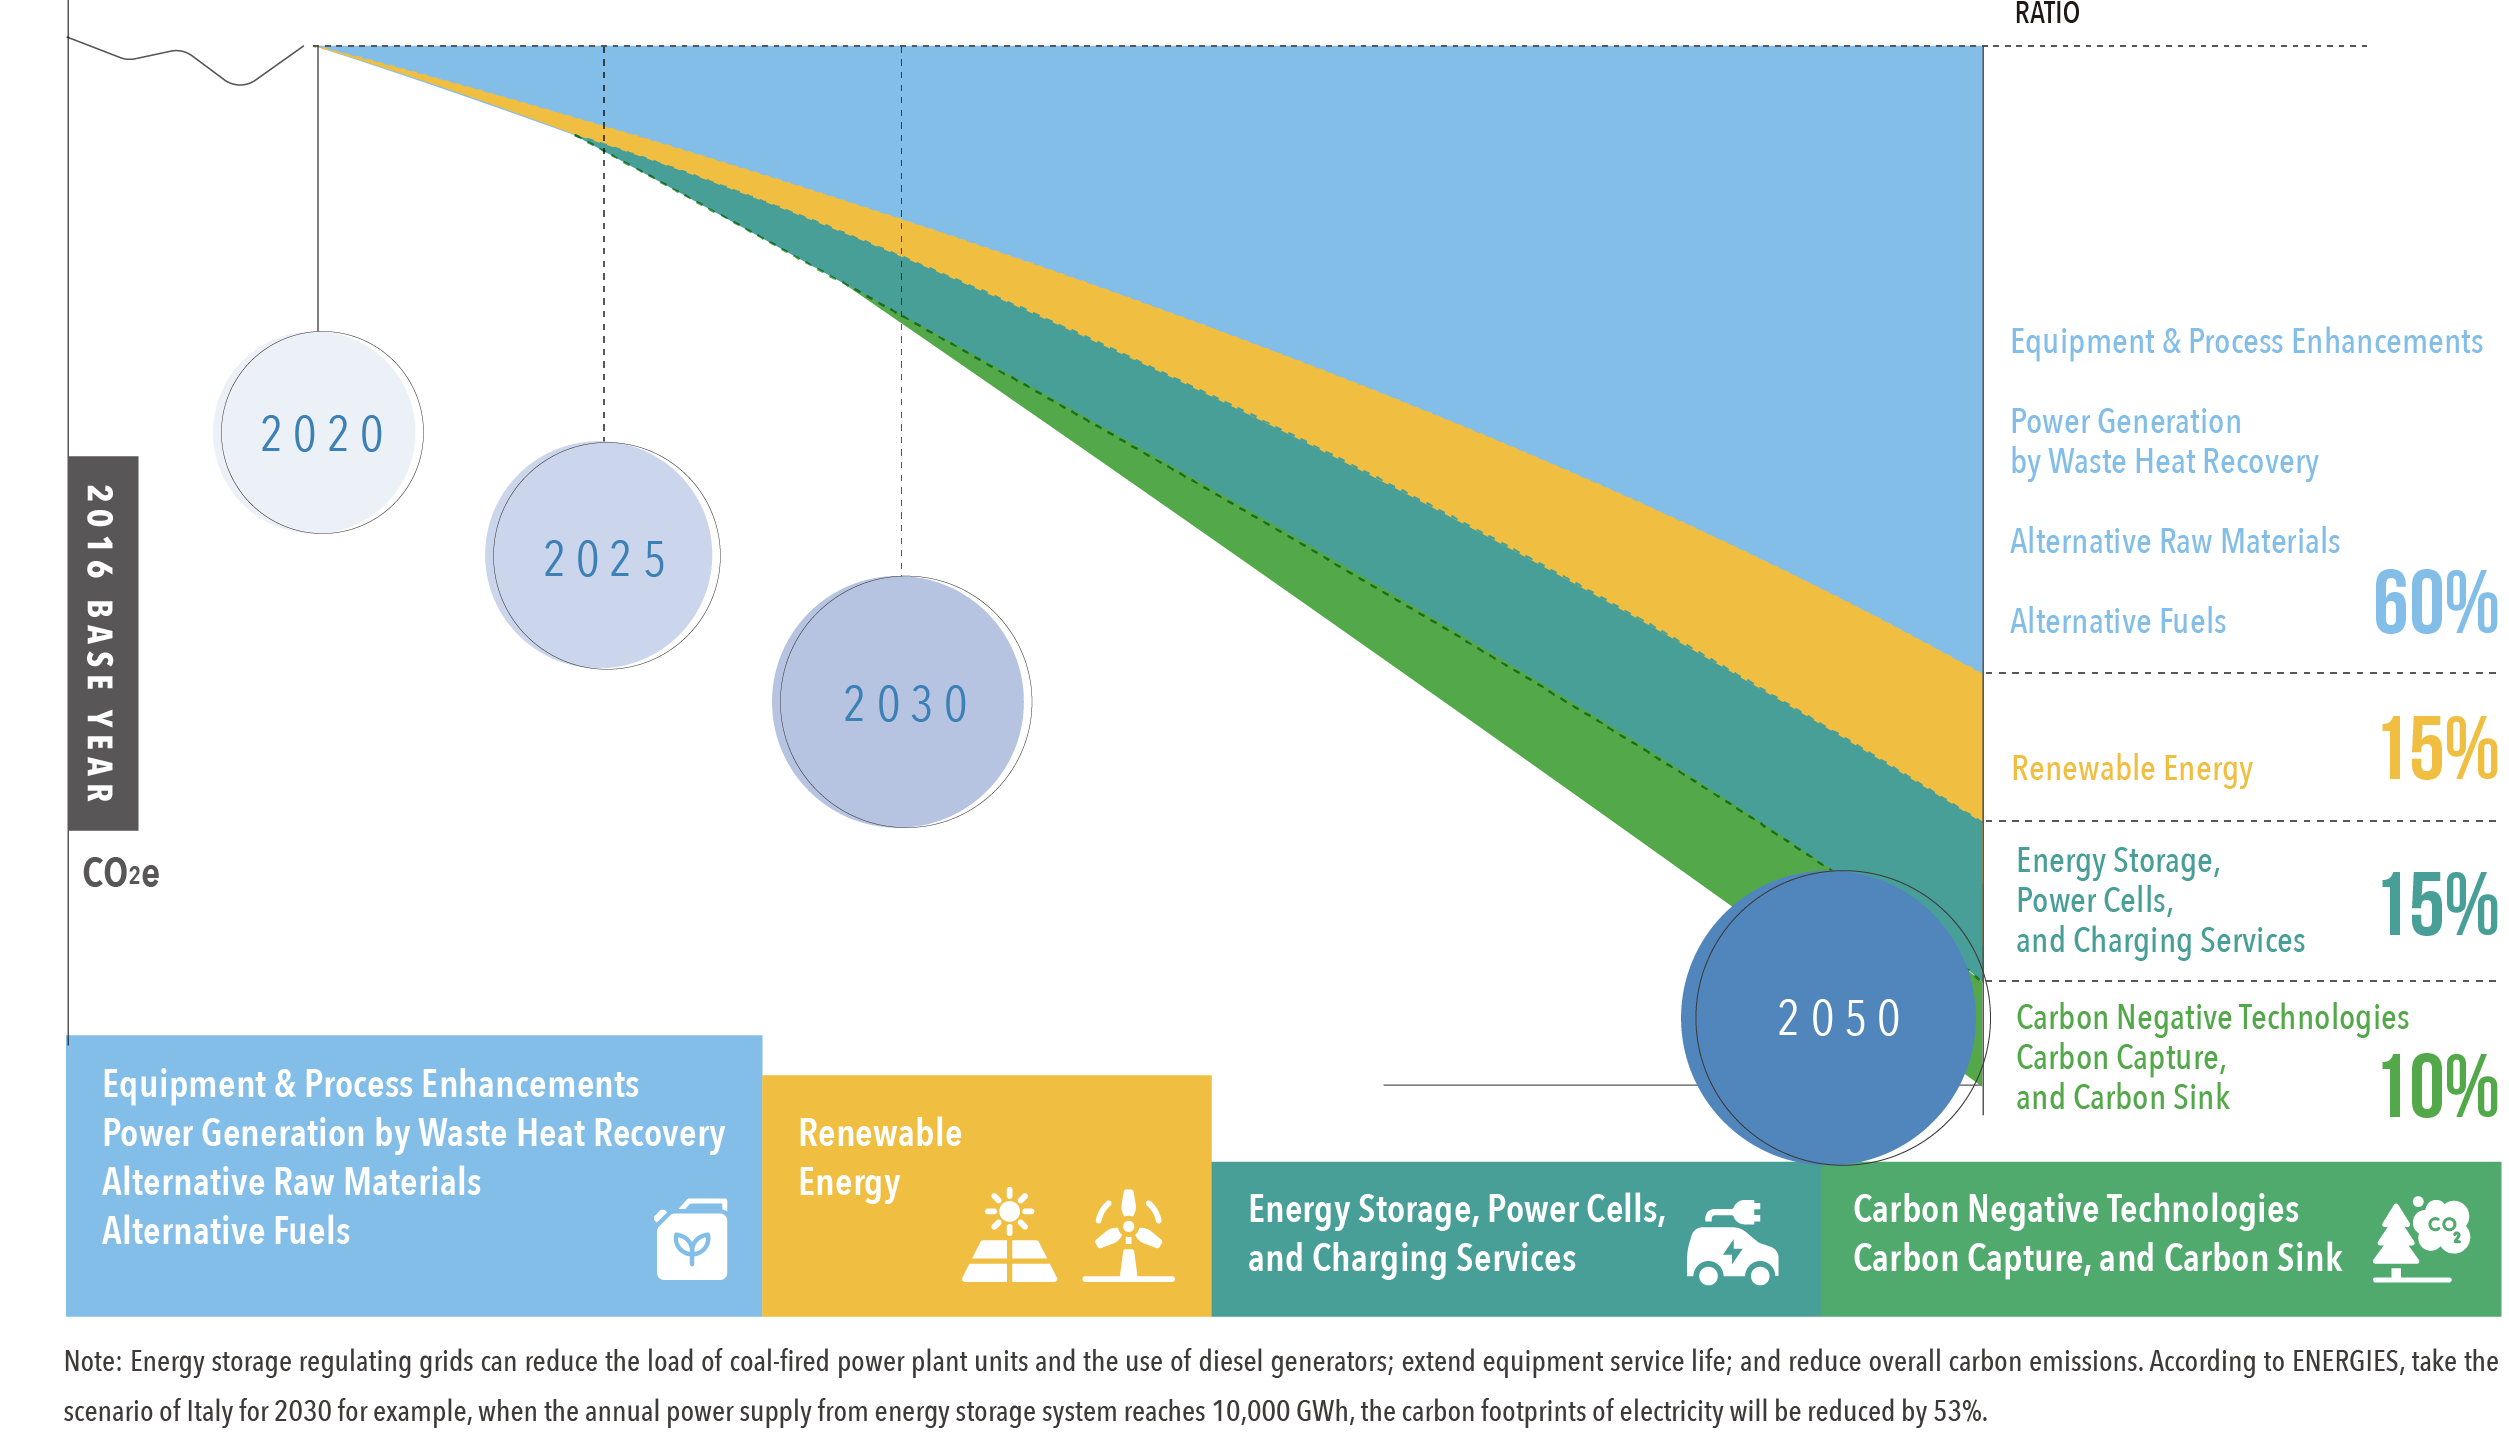
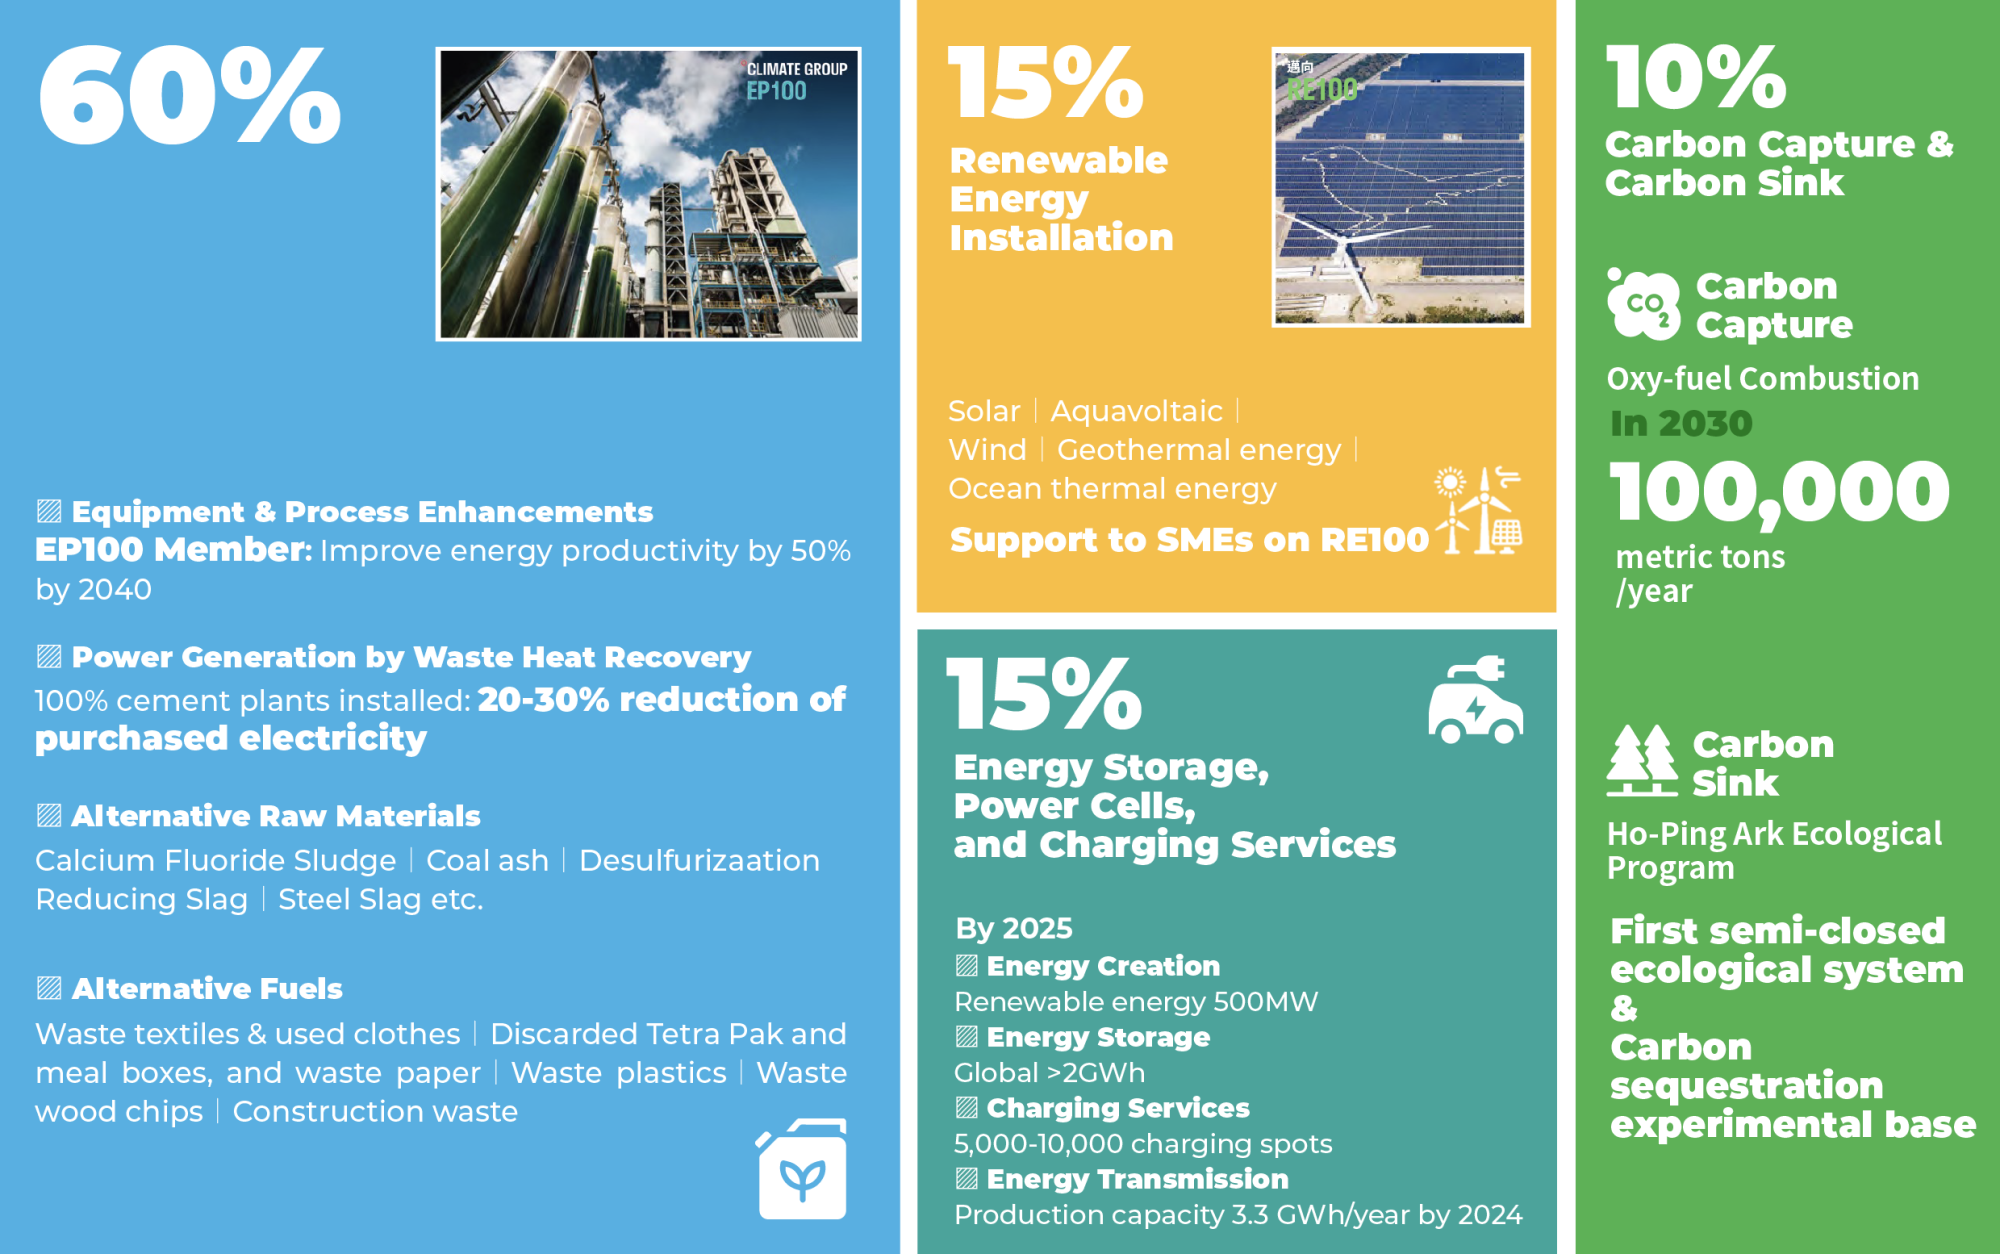
TCC's Roadmap to 2050 Net Zero
ISO14064 GHG Emissions Inventories and Intensity
| ◤ | 100% cement plants, RMC plants, and Operation Headquarters obtained third-party ISO 14064 certification |

TAIWAN
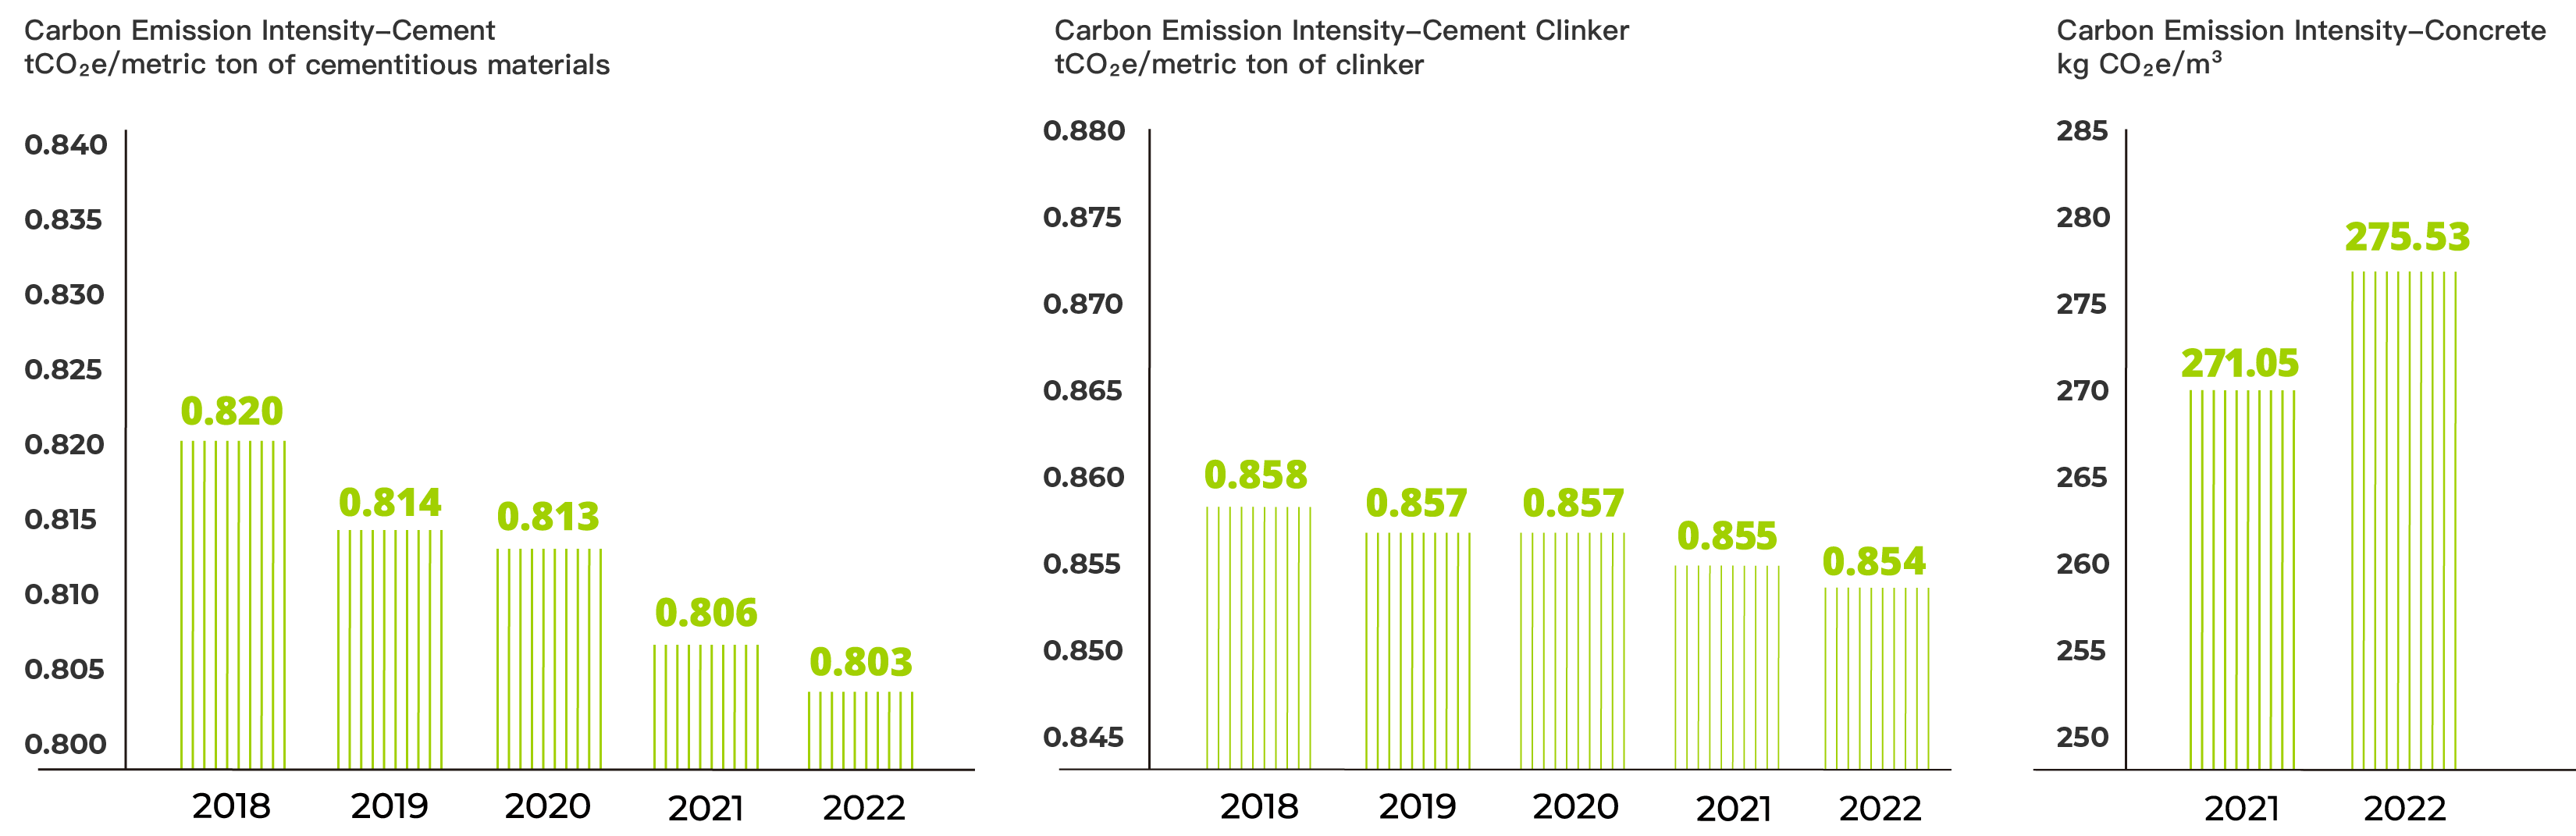
Note: (1) In Taiwan, the GHG emissions inventory comply with EPA regulations and the intensity of each year is based on the third party verification (2)According to “Taiwan Sustainable Taxonomy” released on December 8, 2022, with emissions targeted at ≤0.90 metric tons of CO2e per metric ton of clinker, TCC discloses the carbon emission intensity of clinker for the past 5 years from 2023
MAINLAND CHINA
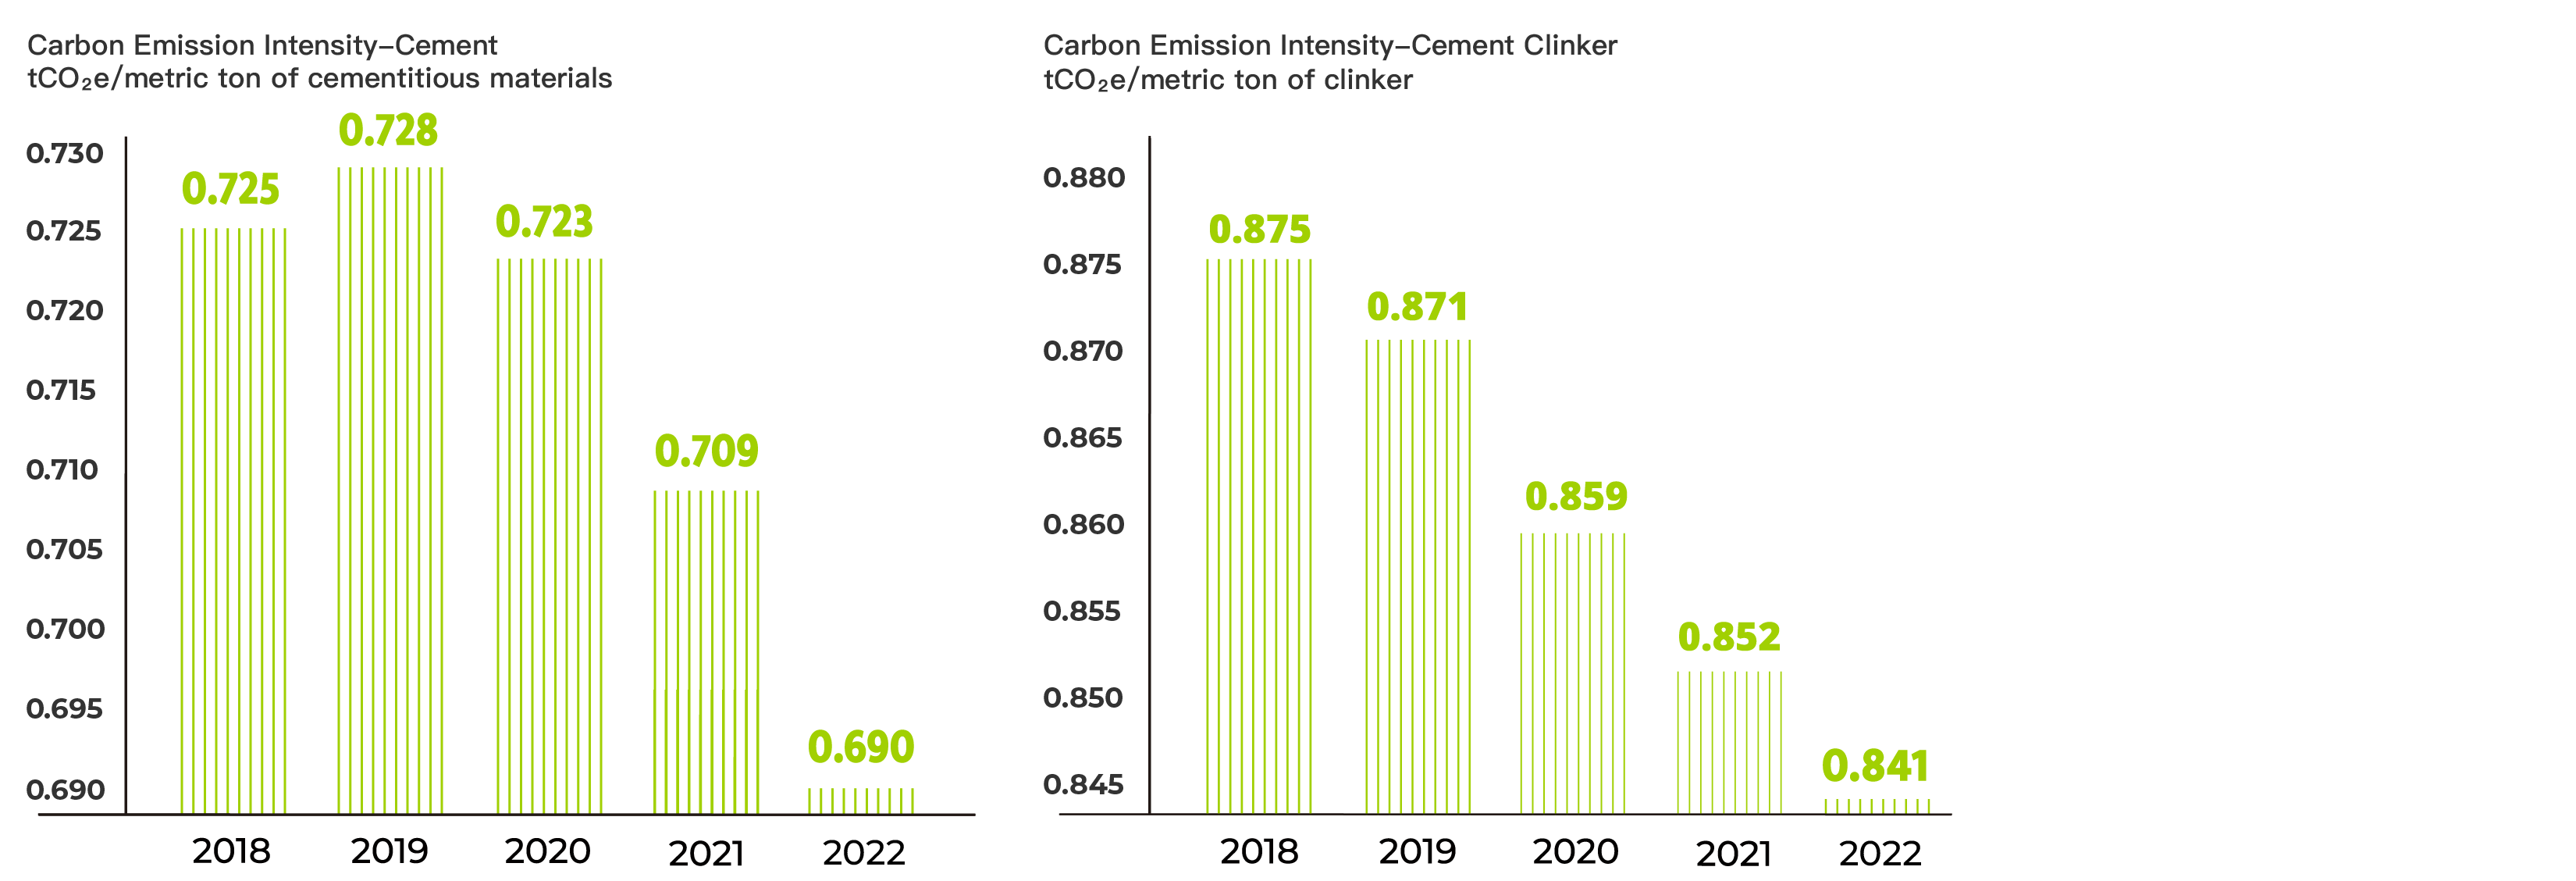
Note: Mainland China conducts GHG inventory in accordance with government inspection standards and cooperates with the local government to arrange the unified inspection work
TAIWAN
GHG Emissions |Unit: metric ton of CO2e
| Item | 2016 | 2017 | 2018 | 2019 | 2020 | 2021 | 2022 | |
|---|---|---|---|---|---|---|---|---|
| Scope 1 | Cement Plants | 4,371,170 | 4,010,642 | 4,228,676 | 4,266,390 | 4,411,086 | 4,797,296 | 4,312,390 |
| RMC Plants | - | 1,733 | 1,992 | 2,088 | 2,059 | 1,517 | 1,776 | |
| Operation Headquarters | - | - | - | 142 | 140 | 132 | 146 | |
| TOTAL | 4,371,170 | 4,012,375 | 4,230,668 | 4,268,620 | 4,413,285 | 4,798,945 | 4,314,312 | |
| Scope 2 | Cement Plants | 250,142 | 230,335 | 245,960 | 223,096 | 202,312 | 212,407 | 210,273 |
| RMC Plants | - | 5,472 | 6,144 | 5,010 | 7,101 | 6,866 | 6,571 | |
| Operation Headquarters | - | - | 2,172 | 1,240 | 1,199 | 1,119 | 1,636 | |
| Total | 250,142 | 235,807 | 254,276 | 229,346 | 210,612 | 220,392 | 218,480 | |
| Scope 1+2 Total | Cement Plants | 4,621,312 | 4,240,977 | 4,474,636 | 4,489,486 | 4,613,399 | 5,009,703 | 4,522,663 |
| RMC Plants | - | 7,205 | 8,136 | 7,098 | 9,160 | 8,383 | 8,347 | |
| Operation Headquarters | - | - | - | 1,382 | 1,339 | 1,251 | 1,782 | |
| TAIWAN | 4,621,312 | 4,248,182 | 4,482,772 | 4,497,966 | 4,623,897 | 5,019,337 | 4,532,792 | |
| Scope 3 | Cement Plants | - | 8,514 | 14,731 | 21,083 | 22,427 | 28,761 | 16,709 |
| Operation Headquarters | - | - | - | 942 | 907 | 814 | 719 |
Note 1: The disclosure of the GHG emissions from the RMC plants in Taiwan started from 2017, so the data for 2016 are not available.
Note 2: The disclosure of the GHG emissions from operation headquarters in Taiwan started from 2019, so the data for the previous years are not available.
MAINLAND CHINA
GHG Emissions |Unit: metric ton of CO2e
| Item | 2016 | 2017 | 2018 | 2019 | 2020 | 2021 | 2022 | |
|---|---|---|---|---|---|---|---|---|
| Scope 1 | Cement Plants | 31,041,758 | 30,534,446 | 31,340,936 | 31,362,071 | 31,255,633 | 25,867,678 | 20,715,305 |
| Grinding Stations | - | - | - | - | - | - | 2,815 | |
| TOTAL | 31,041,758 | 30,534,446 | 31,340,936 | 31,362,071 | 31,255,633 | 25,867,678 | 20,718,120 | |
| Scope 2 | Cement Plants | 1,481,437 | 1,278,526 | 1,303,780 | 1,313,966 | 1,257,882 | 1,094,397 | 846,574 |
| Grinding Stations | - | - | - | - | - | - | 6,487 | |
| Total | 1,481,437 | 1,278,526 | 1,303,780 | 1,313,966 | 1,257,882 | 1,094,397 | 853,061 | |
| Scope 1+2 Total | Cement Plants | 32,523,196 | 31,812,972 | 32,644,716 | 32,676,037 | 32,513,515 | 26,962,075 | 21,561,879 |
| Grinding Stations | - | - | - | - | - | - | 9,302 | |
| MAINLAND CHINA | 32,523,196 | 31,812,972 | 32,644,716 | 32,676,037 | 32,513,515 | 26,962,075 | 21,571,181 |
Note 1: The disclosure of the GHG emissions from the grinding stations in Mainland China started from 2022, so the data for the previous years are not available.
Internal Carbon Pricing
Management Approaches
| ◤ | Daily: AI Carbon Reduction Management Platform real-time data, warnings for achievement situation; Monthly: Reports on executives' management meetings; Annually: Tied with performance bonus |
| ◤ | TCC set an ICP per metric ton at NT$300 as a reference for capital investment strategies and major decision-making. The price was based on the research by the London School of Economics and Political Science, commissioned by the EPA Taiwan in 2020. The feasibility of incorporating ICP at different time points into capital budget investment evaluations is currently being explored |
| ◤ | In 2021, TCC formulates performance appraisal regulations on carbon emission reduction according to the SBT commitment and actual conditions at each plant |
| ◤ | Internal Carbon Trading Platform: TCC launched the platform in July 2022. The Operation Headquarters allocated allowances based on plant production capacity and stipulated carbon intensity targets and emissions caps. The linkage between the system and variable compensation is expected to be strengthened in 2023 to drive the carbon reduction internally |
Results
| ◤ | Taiwan: Carbon reduction achieved a 100% execution rate in 2022. Carbon emission intensity (tCO2e/metric ton of cementitious materials) achievement rate is 97% |
| ◤ | Mainland China: Carbon reduction achieved a 100% execution rate in 2022. Carbon emission intensity (tCO2e/metric ton of cementitious materials) achievement rate is 100% |
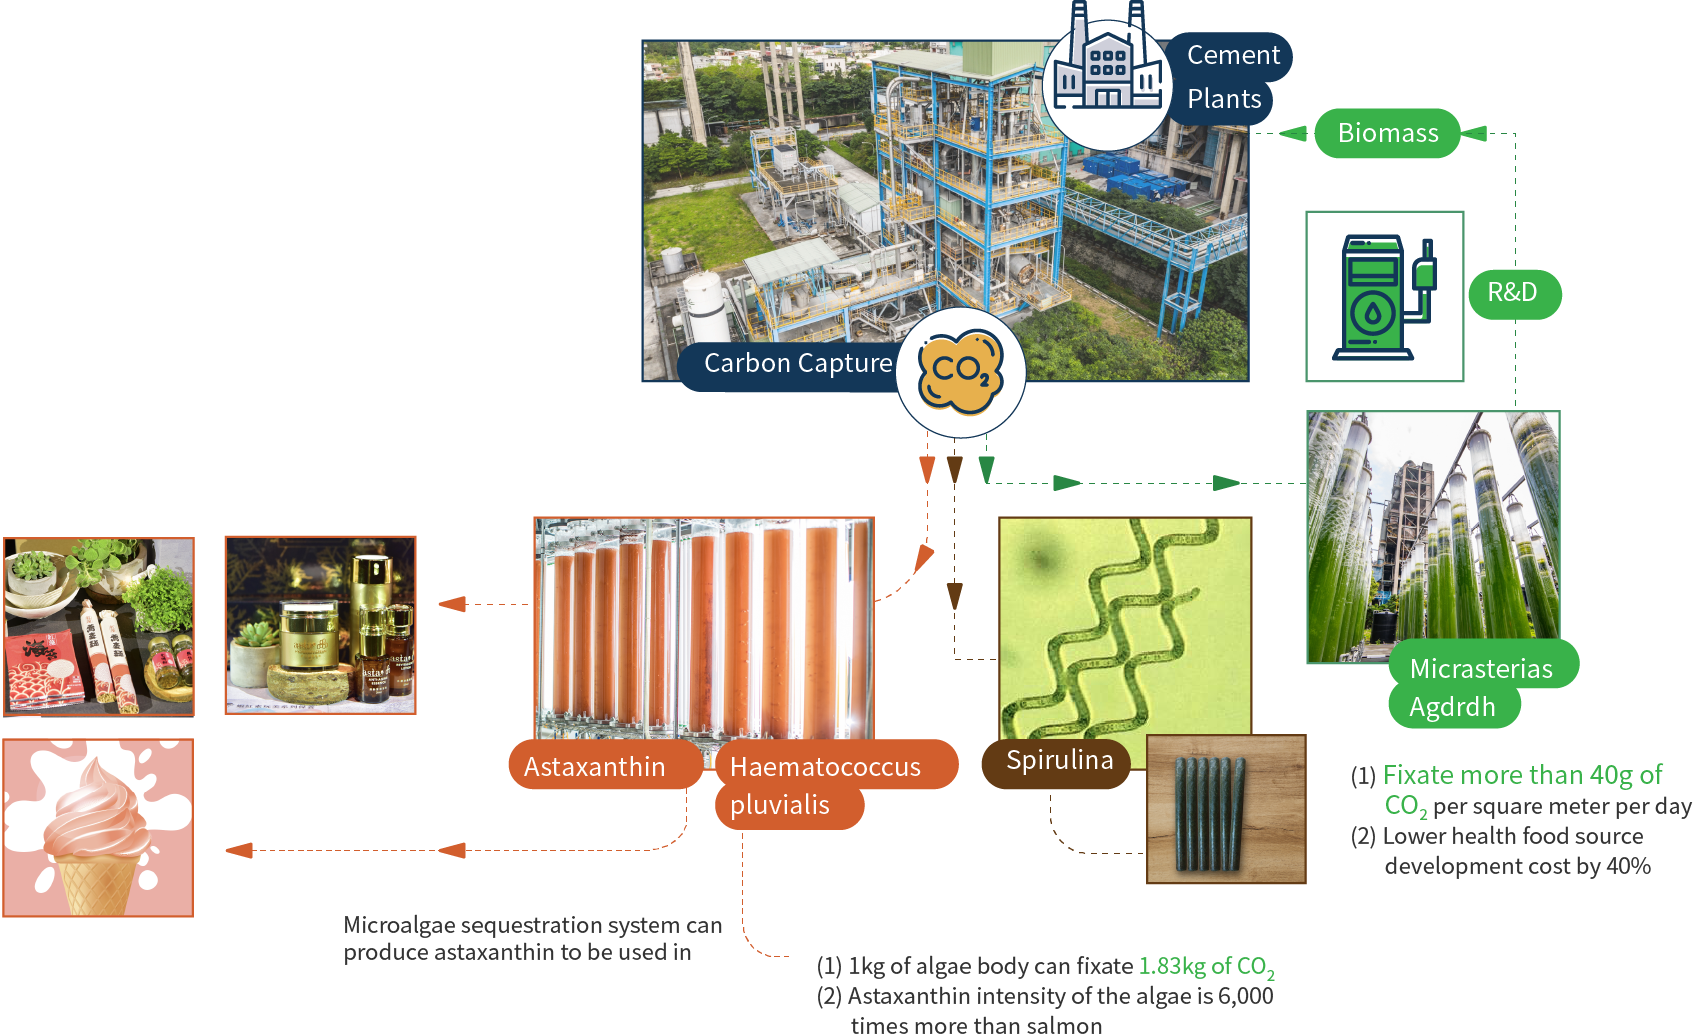
Carbon Capture, Utilization and Storage (CCUS) Microalgae Cultivation for Carbon Dioxide Sequestration
|
|
|
Plan
|
|
Award
|
|
Target
|
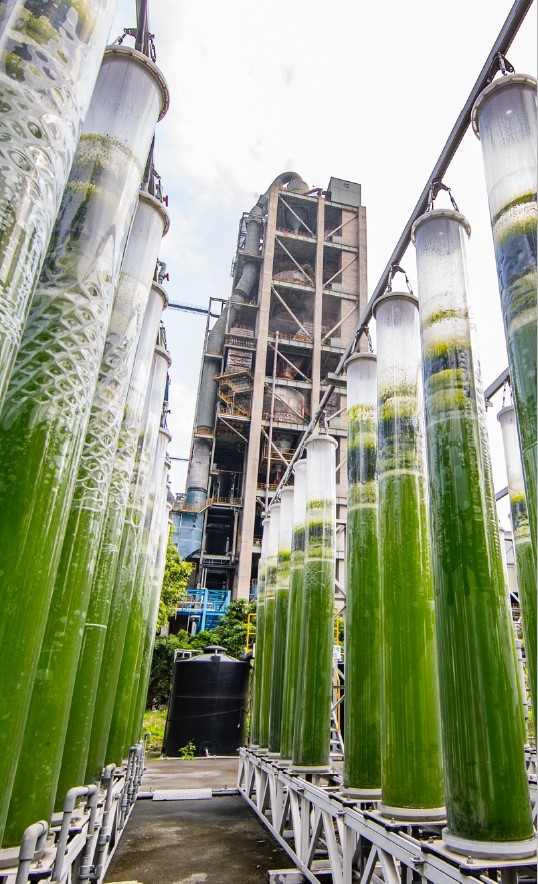
| ◤ | Microalgae Cultivation for Carbon Dixoide Sequestration and Circular Economy |